As part of CodeJam: DataDive 2018, we parsed through New York City’s open source bike-sharing data. We organized the information by time of day, week, and season, to visualize the patterns of bikers in the City of Dreams. Link to project here.
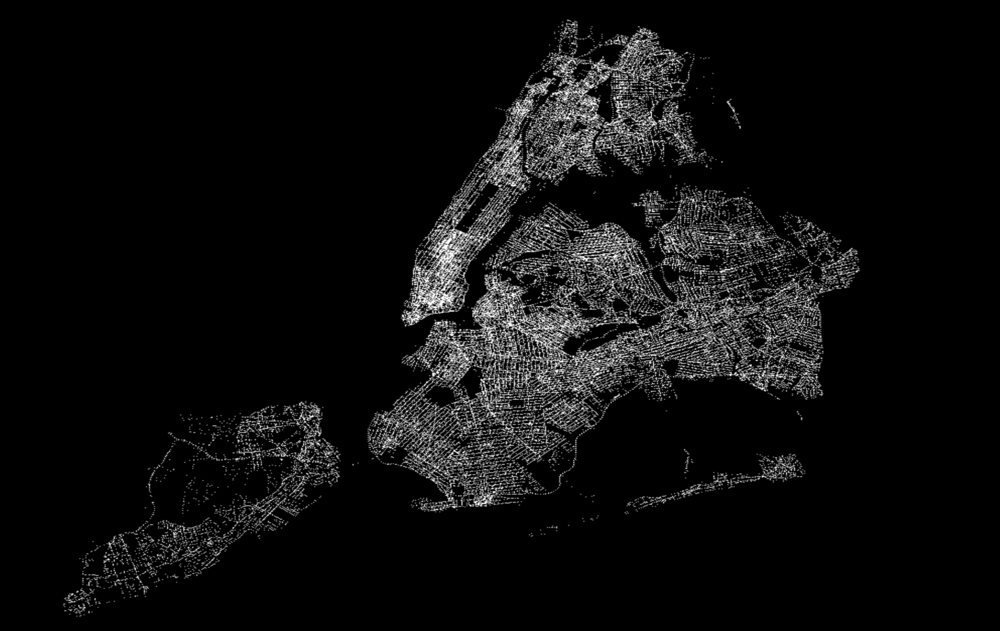
Map of NYC
By plotting the localization of pedestrian and traffic accidents in the city, we visualized the network of roads and bridges. We used this as the basis for our map.
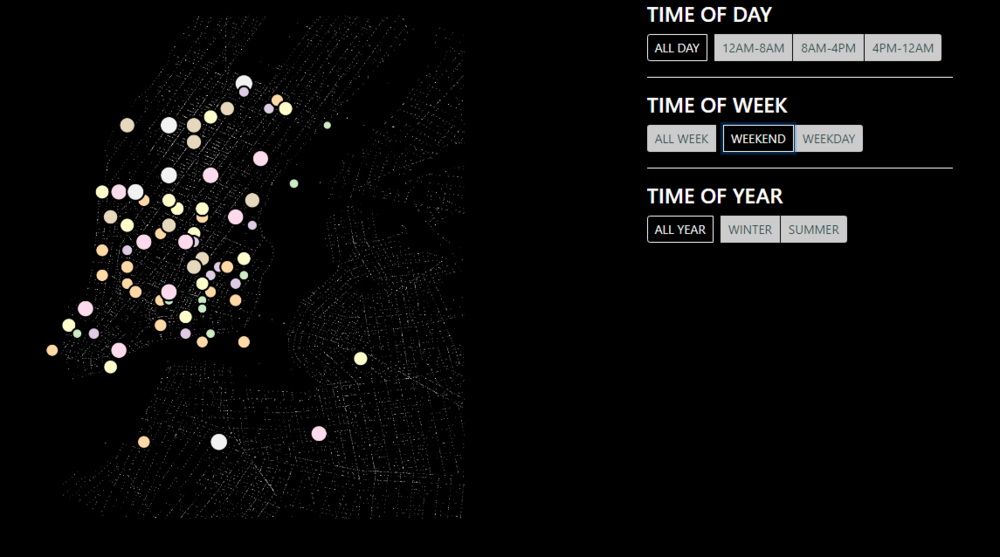
Parsing through the data
Our projects allows you to visualize the trends between bike usage and different times. This is an example of our representation of bike users in the morning on a weekend. Click the link above for a live demonstration.