Processes of Character Evolution
Some characters evolve more quickly than others;
some characters depend on others in their evolution. Discovering
the nature of these evolutionary processes for a character from
an analytical point of view involves determining a model and
its parameters.
Contents
- Single characters
- Correlated characters
Estimating parameters
Maximum Likelihood estimates of rates and biases can be obtained
for categorical characters for two simple models, the Mk1 model
and the AsymmMk model.
For more information on these models, see the page on ancestral
state reconstruction. Mesquite cannot yet estimate parameters
for models of DNA sequence evolution.
Three modules provide calculations
to estimate parameters for the Mk1 and AsymmMk models:
- Mk1
Estimated Rate— Estimates the rate of a character's
evolution under the simple Mk1 model.
- Forward/Backward Rates — Uses maximum likelihood to estmate
the rates of forward and backward changes (0 to 1 and 1 to
0 changes respectively), or alternatively the overall rate
and the bias in gains versus losses, using the AsymmMk model
on a tree for a given character.
- Asymmetry Likelihood Ratio Test — Calculates the test statistic
for the likelihood ratio test comparing the asymmetrical
and one parameter models [2ln(L(Asymm.)/L(Mk1)], on a tree
for a given character.
These calculations consider a categorical character and a tree.
As such, they can be considered to be values describing a character
(and thus are available when analyzing characters, as for instance
in a Characters Histogram or Scattergram or a List of Characters
Window) or values describing a tree (and thus are available when
analyzing trees, as for instance in a Trees Histogram
or Scattergram or a List of Trees
Window). To access them as values for characters, select "Character
value with current tree" or "Character value with tree".
To access them as values for trees,
select "Tree value using character". Two example files
illustrate parameter estimation, Mesquite_Folder/examples/Ancestral_States/15a-estimatingParameters.nex
and Ancestral_States/15b-estimatingParameters.nex
Correlations: Visualizations
To study correlations or associations among characters, there
are both correlation calculators (see Pairwise
comparions, Felsenstein's
contrasts, below) and heuristic visualizations. The latter include:
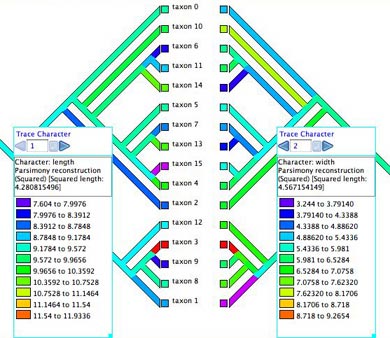
- Mirror Tree Window — When
a Tree Window is open, you can request and alternative view
of the
same tree by
selecting Tree>Mirror
Tree Window. This shows the same tree
as in the tree window, shown in duplicate tips-to-tips. The
purpose of this is to allow you to display two different
visualizations (one at left, one at right) and compare them.
Character correlations can be explored by tracing evolution
of two characters, as shown here.
Example files: Basic_Examples/tree_viewing/08-mirrorTree.nex;
Ancestral_States/15-Mk1AsymmCompare.nex; Pairwise_Comparison/01-pairwise.nex.
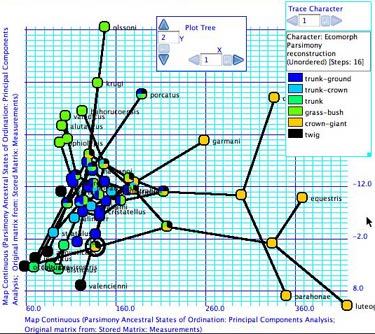
- Plot Tree 2D — Plots the tree
in a 2-dimensional space, available as a tree drawing form
in
the Drawing>Tree
Form submenu. If the axes represent the
state of the taxa in two continuous characters, then
this allows one to map the tree into the character space,
which may suggest patterns or correlations. The internal
nodes of the tree can are placed at the reconstructed ancestral
states. An example is shown here.
Example file: Multivariate_Continuous/07-anoles.nex
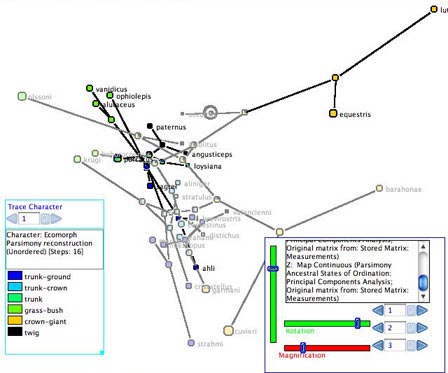
- Plot Tree 3D — Plots the tree in
a 3-dimensional space, available as a tree drawing form in
the Drawing>Tree Form submenu. This is part of
the Rhetenor package. As with Plot Tree 2d, this allows one
to map the tree into the character space. The tree can be
rotated in space using the Rotation sliders in the legend.
An example is shown here.
Example file:
Multivariate_Continuous/08-anoles.nex
- Taxa Scattergram — Select
Analysis>New
Scattergram For>Taxa to
obtain a bivariate plot for taxa.
You will be asked whether to use the same or different
calculations
for the
two axes.
By "Different" is meant two entirely different
calculations, such as the percentage of missing data in the
taxon on one
axis, and the state of a continuous variable on the other.
Choose "Same" and then, if asked, indicate you
want "Continuous
state of taxon". You will therefore be plotting the
taxa according to their states in one character versus another.
If PDAP is
installed, you will be able to do linear regression by
selecting
Scattegram>Analysis>Other
Choices...,
and choosing
one of the Scattergram Diagnostics.
Note: any correlation seen is aphylogenetic. Phylogenetic
correlations can be studied by using the Felsenstein's
contrasts calculations in PDAP.
Example files: Multivariate_Continuous/01-wingsPlot.nex and
subsequent
Correlations: Pairwise comparisions
Character
correlations can be tested using pairwise comparisons as described
by Read
& Nee (1995) and W. Maddison (2000). This is available under
the Analysis menu of Tree Windows. The module chooses pairs
of taxa, and indicates how the pairs compare in two characters:
does the member of the pair with the higher value (say, state
1) in one character have higher or lower value in a second character?
A summary over all pairs is given in the legend, as shown below.
There are three options for choosing pairs:
- Most pairs — choose pairs to maximize number of pairs, regardless of
the states in the characters
- Pairs for one character — choose pairs of taxa that differ in the state
of the first character (independent variable)
- Pairs for two characters — choose pairs of taxa that differ in the state
of both characters
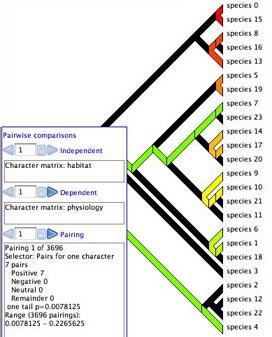
The graphical display shows the current pairing chosen; you
can scroll through all pairings using the legend.
Example files: Pairwise_Comparison/01-pairwise.nex and subsequent
Felsenstein's Independent Contrasts
Correlations among continuous valued characters can be studied
using the separately-available PDAP package
(Midford et al., 2003), which (among other things) calculates
Felsenstein's (1985) independent contrasts and displays them
in a scatterplot:
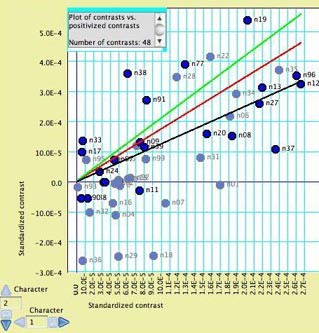
The points in the plot are nodes in the tree, with the X and Y axes representing the independent contrast across the node in
each of the two characters. Regression lines, confidence intervals and other statistics can be calculated by PDAP. When only some nodes in the
tree are selected, they are highlighted in the plot as shown above.
The PDAP documentation or example files should be consulted for more details.
Use with Pagel's Discrete and Multistate
Mesquite does not yet perform Pagel's (1994) test for correlation among categorical characters, but it can import and export files
for use by the Discrete (Pagel, 2000) and Multistate (Pagel, 2002) programs. For import, attempt to read the Pagel format file
in Mesquite, and choose the file format from the import dialog box. For export, select the Export... menu item from the File menu.
References
Felsenstein, J. 1985. Phylogenies and the comparative method.
American Naturalist, 125:1–15.
Maddison, W.P. 2000. Testing character correlation using pairwise
comparisons on a phylogeny. J. Theoretical Biology. 202: 195-204.
Midford, P. E., T. Garland Jr. & W. Maddison. 2002. PDAP:PDTREE
package for Mesquite, version 1.00.
Pagel, M. 1994. Detecting correlated evolution on phylogenies:
a general method for the comparative analysis of discrete characters.
Proc. R. Soc. London B 255: 37-45.
Pagel, M. 2000. Discrete, version 4.0. A computer program distributed
by the author.
Pagel, M. 2002. Multistate, version 0.6. A computer program distributed
by the author.
Read, A. F. and S. Nee. 1995. Inference from binary comparative data.
J. Theoretical Biology 173:99-108