|
|
Molecular data
Molecular data (DNA or protein sequences) can be edited, manipulated,
simulated and analyzed in
various
ways in Mesquite. Most of the features discussed elsewhere concerning
editing and analysis of general categorical data also apply to
molecular data; here we focus on features specifically designed
for sequence data.
Contents

Editing molecular data
Molecular data can be imported from files of NBRF format, PHYLIP
format, and simple table format. It can also be exported to these
formats.
The Character Matrix Editor can
be used to edit a molecular sequence matrix. Standard ambiguity
codes are allowed.
The following can be applied to all or the selected portions
of a molecular sequence matrix in the Character Matrix Editor.
These are available under the Alter/Transform submenu of the
Matrix
menu:
- Nucleotide complement (DNA matrix only) — enters
the complementar sequence into the selected cells
- Reverse sequence — reverses the order of contiguously selected
blocks of sequence
Other options may appear; see the page on characters for
standard choices in this submenu. You can also apply the other
editing tools described for character matrices.
Simulating DNA sequence evolution
DNA sequence evolution can be simulated to build statistical
tests, for instance via parametric bootstrapping. See the page
on simulating
DNA sequences.
Statistics for DNA sequences
Calculations for categorical characters in general can be applied
to DNA sequences. For example, Parsimony
calculations can be made for DNA sequences, as can
basic descriptive statistics such as the percent of a sequence
or character that is missing data or gaps. In addition, there
are several modules specifically designed for DNA data, illustrated
by examples in Mesquite_Folder/examples/Molecular.
These calculate compositional bias:
- ACGT Compositional Bias — This module
supplies the compositional bias of taxa, measured over the
taxon's sequence. The bias
is treated as a continuous character, and thus can be used
wherever characters are used, as for instance in the reconstruction
of the evolution of compositional bias as shown in the image
below. It can return either the proportion
G+C, or separately
A,
C, G, and T proportions.

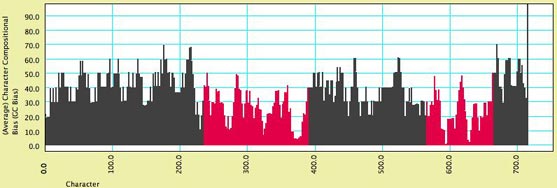
- Character Compositional Bias — This module supplies
the compositional bias for characters. It calculates the
percent of taxa with particular nucleotides (GC bias,
or
individual
frequency of A, C, G or T) for a character. The image below
shows a moving window analysis of compositional bias along
a sequence; the instructions for generating the chart are
given here.
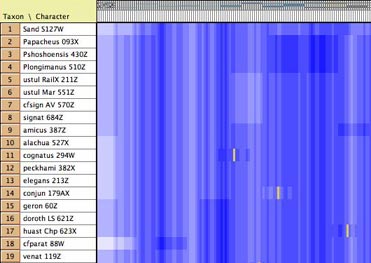
- GC bias coloring of matrices — The
cells of the Character Matrix Editor may be colored according
to a moving window of GC bias along the sequence, as shown below,
by selecting Matrix>Color
Cells>Color By Cell Value, then once shown the
colors can be smoothed by a moving window analysis by selecting
Matrix>Moving
Window (for colors).
Statistics for Protein Data
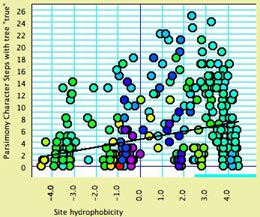
- Site hydrophobicity — This module supplies the average
amino acid hydrophobicity, averaged across taxa, for each
site. It can be used in charts, for instance to see the relationship
between a phylogenetic statistic for the site (character)
and it average hydrophobicity. This chart, for example, shows
parsimony character steps as a function of hydrophobicity:
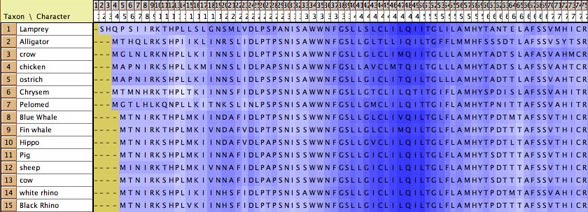
- Amino Acid hydrophobicity — The cells
of the Character Matrix Editor may be colored according to a
moving window of hydrophobicity along the sequence, as shown
below, by selecting Matrix>Color
Cells>Color By Cell Value, then once shown the
colors can be smoothed by a moving window analysis by selecting
Matrix>Moving
Window (for colors).
Visualizing tertiary structure
Although
there are not yet dedicated windows for visualizing phylogenetic
statistics in the context of molecular structure, features
have been added to the Scattergram chart to allow it
to be adapted for this purpose. For instance, in this image cytochrome
B is shown, with the amino acids colored according to a simple
phylogenetic statistic: the number of parsimony steps on a phylogeny.
The colors are smoothed by a moving window, and show that several
coils of the molecule, a few at the left and one deep at the
right, evolve more rapidly than others. This example is illustrated
in the data file at Mesquite_Folder/examples/Molecular/06-cytochromeB.nex

To build such a chart, begin with a file with a matrix of protein
sequences. The procedure is also described in the example
files 08-cytochromeBlinked.nex and 09-cytochromeBscatter.nex.
- Select New Linked Matrix from the Characters
menu. When a matrix is made to be linked to a second matrix,
the two matrices are constrained to have the same number
of characters.
- Indicate that you want the linked matrix to be a Continuous
matrix, and link it to your protein matrix. Then, turn
it into a three dimensional matrix (Taxa X Characters X Coordinates
[x, y
and z]) by
using
Add Item and Rename Item in the Utilities submenu of
the Matrix
menu of the Character Matrix Editor. The x,y,z coordinates
could be added for all taxa if known, but otherwise only
one taxon needs to be filled
out (because we will use the average x,y,z coordinates
for the amino acids).
- Once the linked matrix of xyz amino acid positions is entered,
select Analysis>New
Scattergram for> Characters. Indicate you want
the scattergram to be for Stored Characters, and indicate Same value
for the two axes. In the dialog box "Values for axes", choose
Mean Value of Character (Linked Matrix).
In response to "Use characters from which matrix? (for Character
Source)"
choose the
protein sequence matrix as the matrix to be used. This will
plot the sites (amino acids, characters) in their correct
places, but as a series of round spots.
- To change the appearance of the plot, select Join
the Dots in the Special Effects
submenu of the Scattergram menu. Then select Thick
Joints,
deselect Show Dots, deselect Join
First to Last, and set
the marker size larger (e.g., 8).
This will result in a plot as shown above, but without the
colors.
- Next, choose Color by Third Value from
the Colors menu and choose the value by which to color the
amino acids. For parsimony steps, for instance, choose Character
Value with current tree.
- Finally, to use a moving window to smooth the colors,
select Moving
Window for Colors from
the Colors menu and indicate the window size (e.g., 5).
Sequence data within populations
See the page on population genetics.
Reconstructing ancestral states
Ancestral states of continuous characters can be reconstructed
as described in the page on reconstructing
ancestral states. Likelihood methods are not yet available
for molecular characters.
|
|