Performance Monitoring of MySQL through network trace parsing.
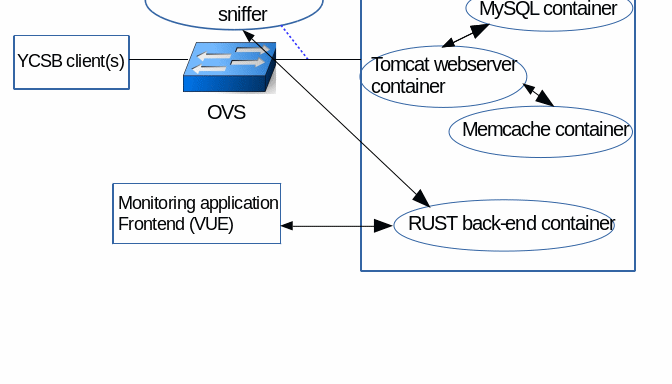
These three projects will be integrated with an existing prototype of the monitoring platform. The platform and its usage for a distributed web application is illustrated in the following figure. The platform is mainly made up of three components:
Sniffer
The sniffer is a component that is attached to the software switches of the cloud that route the cloud traffic. The sniffer, written in C, listens to relevant network traffic and performs some of the performance analysis on the fly by analyzing specific network messages. For instance, it can determine service response times by taking the time difference of receiving a service request message and the corresponing service response message, and calculate thus average response times in each interval. Other examples are request rates, average sizes of responses, etc.
For doing such analysis work, the sniffer reads and extracts all the information needed from the network packets. The information is then stored in different data structures, typically hashtables (e.g., one for client relevant information, one for paths, etc.). In given time intervals, the individual metrics such as average response times are then computed. On a regular basis, the results are sent to a backend analysis server.
The sniffer requires the network interface name of network flows to be observed, and some analysis configuration (interval, duration, metrics choice). It can run several analysis at the same time.
Frontend
The frontend component has two purposes. First, it is the component where an application administrator can indicate what kind of performance monitoring should be performed on their application. For that, the frontent provides a form to collect the relevant information (choice of performance metrics, source, destination, analysis duration). Second, the frontent shows the performance results over time in near real-time.
The frontend part is built on top of Vue.js, a reactive js framework, and Ricksaw.js (shutterstock), a graphing library build on top of D3.js.
Once an administrator has provided the details of what should be monitored, the frontend sends this information to the backend. The frontend receives then the performance results for visulation from the backend. Communication between frontent and backend is done via a bidirectional and persistent WebSocket (where the frontend is the client initiating the communication and the backend is the server accepting connections).
Backend
The backend is mainly a broker between the frontend clients and the sniffers that enables a unified web-based interface for users to the monitoring platform. It forwards the specific monitoring requests from the clients to the relevant sniffer and receives the performance measurement results from the sniffers to be forwarded to the clients. It might also perform some analysis tasks itself should they be too time consuming to be executed at the sniffers that have to work at network traffic speed.
The backend is a simple rust application. Rust is a new compiled language, which is pretty fast (execution time benchmarks show it performs faster than c++) and safer because of a lot of protection mechanisms on compilation time. It also comes with a web server ecosystem which makes it a good choice for a web server. Finally, it can compile in web assembly, which makes it also a good choice to develop frontend features. Apart of the WebSocket connections with the active frontend clients, the backend also maintains a bi-directional TCP socket with each of the sniffers. Message format uses Google protocol buffers.
We use so far a modified version of the YCSB benchmark as an example distributed application to test our system. YCSB is originally a database benchmark where a YCSB client sends requests to a database. Our extended version has added a Tomcat webserver as frontend for the client (which was modified to communicate with the Tomcat server); the Tomcat server has access to a MySQL database and a Memcache server. Each component is deployed in a separate container and all containers are connected by an OVS switch configured via Openflow. The clients submit a predefined workload of HTTP requests to the web server whereby each request retrieves data from either the database or the memory cache. Recent results are cached in the Memcache server. The data-base schema and the query requests follow the YCSB benchmark.
Our current monitoring prototype monitors only HTTP network traces. Thus, it is only able to monitor the traffic between the YCSB clients and the Tomcat Server of our example application and therefore can only provide performance metrics such as request rate and response time for the Tomcat server.
This Fall, we would like to expand its capability so that it can also monitor the performance of membaches and MySQL as well as provide performance information when HTTPS is used. In particular, for the three projects mentioned above, the goals are as following:
1. Performance Monitoring of Memcache through network trace parsing.
Memcached is an open source distributed memory caching system. It is used for speeding up dynamic web applications by reducing database load. In other words, every time a database request is made it adds additional load to the server. Memcached reduces that load by storing data objects in dynamic memory (think of it as short-term memory for applications). Memcached stores data based on key-values for small arbitrary strings or objects. At a high-level, clients (in our case the Tomcat server) use Memcached in the following way:
A typical setup has various Memcached servers and many clients. Clients use a hashing algorithm to determine which Memcached storage server to use - this helps distribute the load. The server then computes a second hash of the key in order to determine where it should store the corresponding value in an internal hash table. A few important points about Memcached architecture include:
The project aims to provide some performance metrics about a memcached system by only looking at the messages exchanged between clients and the memcached servers by parsing/decoding Memcached network packets. Example of required performance metrics are:
For this project, the student first needs to get a clear understanding of the memcached communication protocol format, then, he/she needs to develop the software that extracts the relevant information from the packets and calculates the particular measurements. The software needs to be tested on our example web application.
2. MySQL network traces parsing
MySQL is one of the most used open-source relational database management system. The project aims to provide some performance metrics about a MySQL database by only looking at the emssages exchanged between clients and the MySQL database system by parsing/decoding MySQL network packets. Examples of required performance metrics as:
For this project, the student first needs to get a clear understanding of the request/reply protocol between clients and MySQL. Then, he/she needs to develop the software that extracts the relevant information from the packets and calculates the particular measurements. The software needs to be tested on our example web application.
2. Supporting monitoring of HTTPS traffic despite encryption.
The Hypertext transfer protocol secure (HTTPS) is the secure version of HTTP, which is the primary protocol used to send data between a web browser and a website. HTTPS is encrypted in order to increase security of data transfer. This is particularly important when users transmit sensitive data, such as by logging into a bank account, email service, or using health insurance providers. HTTPS uses an encryption protocol to encrypt communications. The protocol is called Transport Layer Security (TLS),In order to be able to use our monitoring framework to monitor a webserver that uses HTTPS, the user should provide the monitoring tool with the cipher suit algorithm code and keys so that our tool is able to decrypt the HTTPS packets. The aim of this project is to design a framework for securely exchanging this kind of information between the user and the network monitoring tool, and successfully decrypt the payload of the HTTPs packets using this information.